Data selection & visualization tools
Last updated About 1 year ago
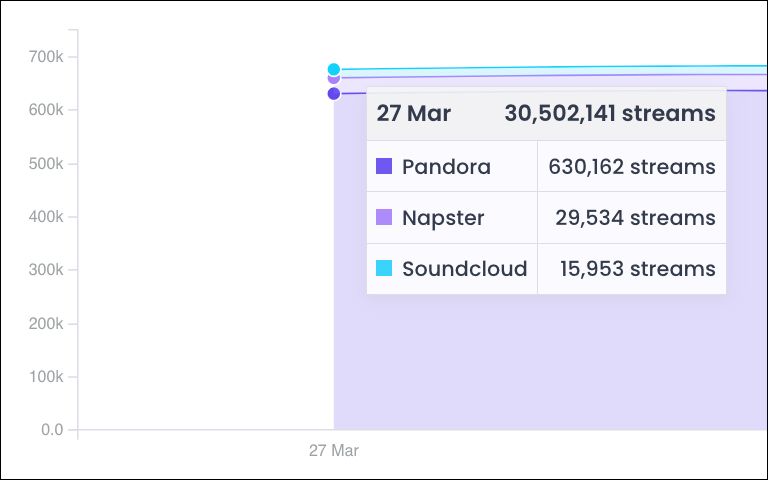
Various clarifications are displayed with the charts available in Trends to specify if the data displayed come from a specific and limited set of sources.
Breakdown of streams by platform displayed by hovering mouse pointer:
Filters: various filters are available at the top on the different sections of Trends, allowing you to narrow down the sources of the data sets displayed to specific Periods of time, Release Lifecycle, Retailers, Types (of consumption), Genres, Playlists, Contracts, Labels, Projects, Artists, Albums, Tracks or Album Tags.
Filters available at the top of most sections in Trends:
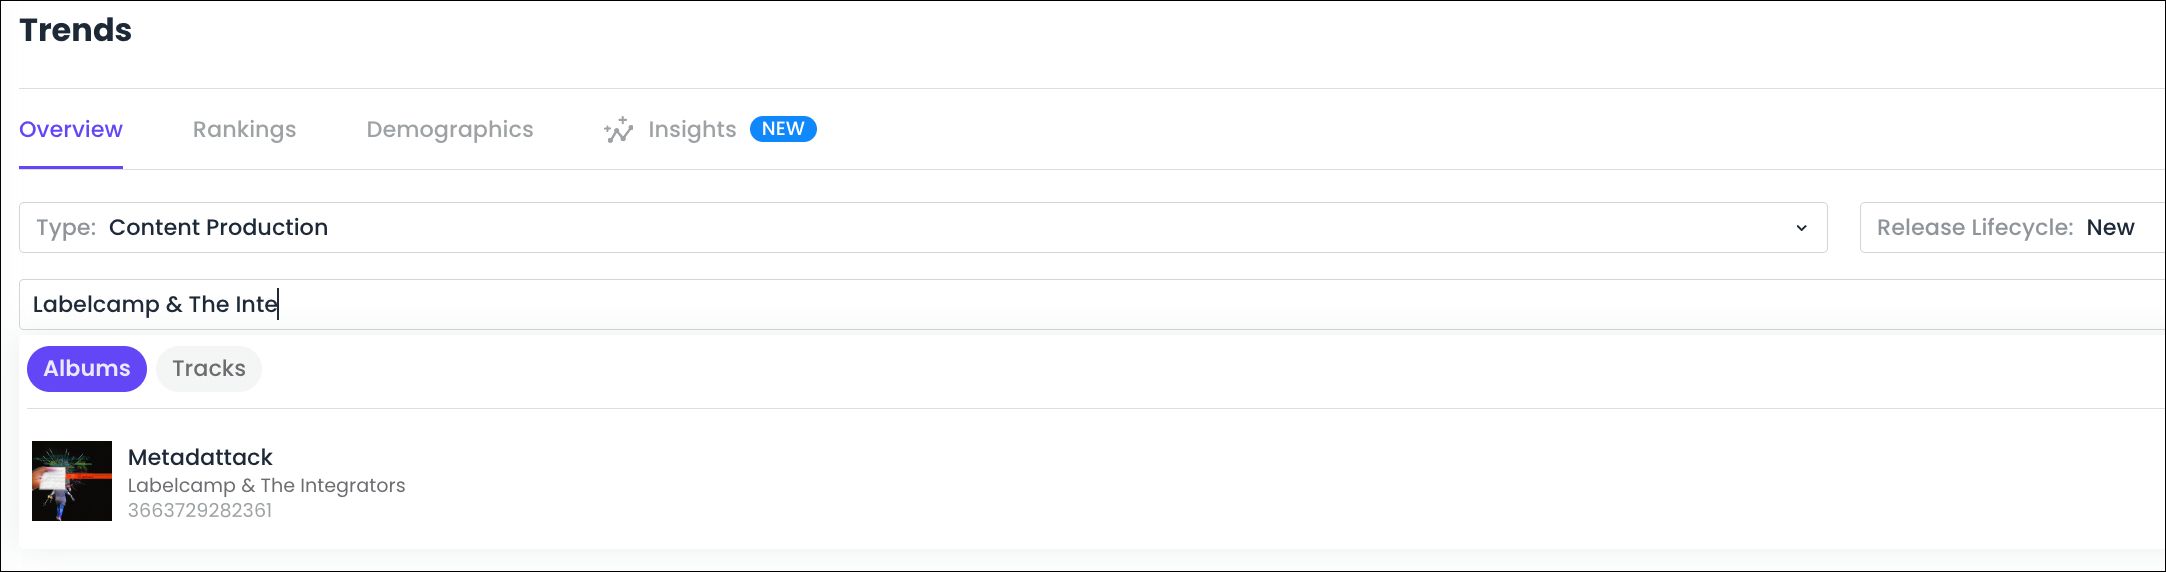
As filters applied on data sets are mirrored in Labelcamp URLs, bookmarking URLs in your web browser offers a great shortcut to filtered data sets you need to frequently access.
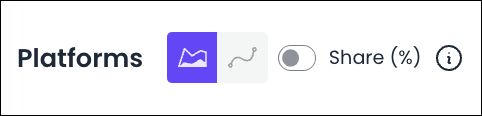
Stacked Area Chart / Line Chart selector: this selector button available on any chart can be used to switch between a Stacked Area visualization (i.e. cumulative view of the selected data) and a Line Chart visualization (i.e. simple evolutive view of the selected data).
Share (%) toggle button: this toggle button available for charts detailing multiple data sets can be used to visualize the share of a given data set in comparison to the other sets and their sum.
Stacked Area Chart / Line Chart & Share (%) toggle button available at the top of charts:
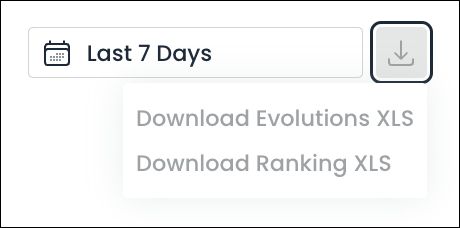
Data download button: download buttons are displayed at the top right corner of each data visualization module available in Trends to download the raw figures in an XLS file, with 2 options available :
Download Evolutions XLS: to download the data displayed in the corresponding chart
Download Ranking XLS: to download the data displayed in the corresponding table
Data download button available above charts displayed in Trends: